
What If Nature Had a Risk Profile? Modelling Ecosystem Health for Finance
This article walks through an illustrative model that applies familiar financial and actuarial techniques to translate ecosystem health into financial risk metrics.
The last two articles established why nature belongs in financial analysis. One showed how high discount rates can erase long-dated ecosystem value and risk from today’s valuations. The other showed how leaving nature out altogether can misprice nature-dependent assets and create avoidable stranded-asset risk.
This piece takes the next step. It shows how to represent nature as a dynamic asset, model how ecosystem condition changes through time, and translate those changes into a financial risk profile. That matters because reefs can recover, soils can rebuild, and fisheries can be restored — and finance needs a way to see those pathways clearly enough to act on them.
Today’s challenge is can finance start treating nature as a dynamic, uncertain, economically material asset and whether familiar risk techniques can be used to show what that means for value, impairment, and intervention. That is what this article sets out to explore.
What it takes to model nature economically
If nature is to be treated as a dynamic, uncertain, economically material asset, then the first step is to represent it as a system rather than as a static backdrop. Ecological science already gives us deep understanding of many of the component parts: species, stressors, nutrient dynamics, disturbance regimes, recovery pathways. The challenge is to bring those elements together into models that describe how an ecosystem actually functions over time, because that functioning is what generates the ecosystem services businesses and communities depend upon.
That means building dynamic ecosystem models: models that represent how the system responds to changing environmental conditions, how different parts interact, and how resilience weakens or strengthens through time. This is not a new ambition within ecology, but it now needs to become more usable in an economic context. And that is not just a scientific nice to have. As climate change and ecosystem degradation push natural systems toward more novel conditions, regime shifts, and potentially irreversible tipping points, improving our systems-level understanding of nature becomes essential to any credible attempt at managing the climate and nature reversal.
Even with good ecological models, however, there is no credible way to predict a single precise ecosystem outcome many years into the future. These systems are too complex, too path-dependent, and too exposed to changing external conditions. So, the aim is not prediction in that narrow sense, but a risk estimation using a model of ecosystem behaviour together with stochastic techniques to generate a distribution of plausible outcomes under certain conditions, rather than a single prediction.
In simple terms, stochastic modelling means acknowledging the range of plausible inputs, running many simulations, and observing the distribution of outputs that results. That allows us to simulate not only the expected outcome, but the probability of better and worse outcomes, and how that changes under intervention.
The Jamaica case study is a simple example of how that can be done in practice. It uses a dynamic ecosystem model and a stochastic scenario framework to move from ecological mechanism to ecosystem risk profile, and then toward financial interpretation.
The Jamaica seagrass case study
To make this concrete, consider a seagrass meadow in Jamaica. Seagrass meadows are productive coastal ecosystems that support fisheries, stabilise sediments, influence water clarity, and contribute to carbon sequestration. In places like Jamaica, they also sit within wider coastal systems that matter economically because they support tourism, shoreline stability, and the resilience of nearshore environments. Their condition depends on a combination of environmental variables, including temperature, salinity, light availability, nutrient concentrations, and physical disturbance. Here we model the tropical seagrass system over a twenty-year horizon.
The management question tested in this case study is also concrete: what happens to ecosystem resilience if nitrogen pressure on the meadow is not reduced versus what happens following intervention?
The results shown here are for an inner, shallow, sheltered part of the bay where runoff is more likely to accumulate; other parts of the bay were also represented in the wider modelling framework, but are not shown here, and the outputs should be read as indicative rather than as the result of a full site-wide investigation.
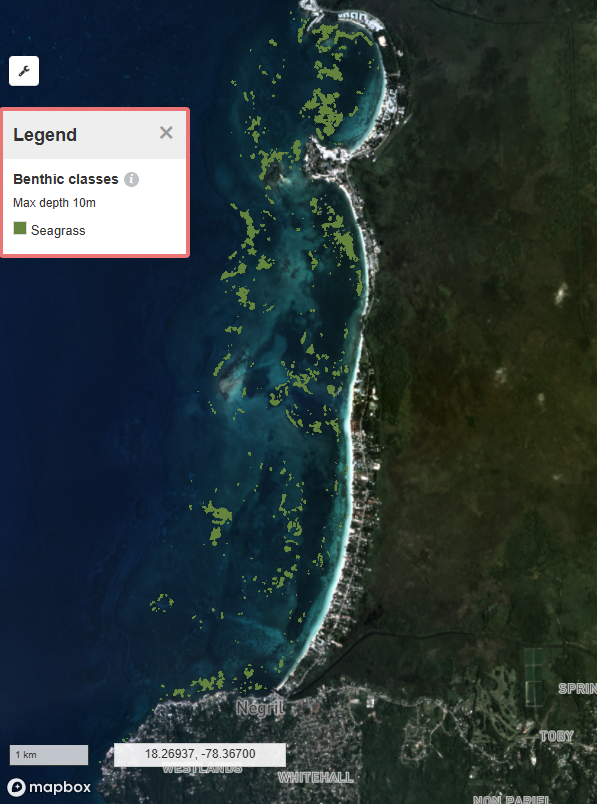
Figure 1. Seagrass extent in Negril Bay from Allen Coral Atlas; mapped extent is shown for spatial context.
How the model works
To treat nature as a risk-bearing asset, the model needs to do two things: capture how the ecosystem functions and map the uncertainty of the world around it.
The first layer is the dynamic ecosystem model. This tracks how a seagrass meadow grows, competes, and recovers day by day. It simulates how light, temperature, nutrient runoff, and storms interact. A single shock, like a storm, might strip away biomass, but chronic stress—like nutrient overload—weakens the meadow's root system, killing its ability to bounce back. Push the system too far, and it collapses.
The second layer is the stochastic scenario framework. Rather than guessing one single future, we run the ecosystem model through thousands of 20-year simulations. One scenario might roll out a stable decade of clear water and moderate temperatures. Another might hit the meadow with a marine heatwave, followed by two back-to-back hurricanes and severe runoff.
Extreme scenarios like that "perfect storm" are possible but carry a lower probability. Other combinations are far more common. By running thousands of these plausible futures, the model stops trying to predict a single outcome and instead builds a probability distribution. It reveals the expected average, but more importantly, it maps the worst-case tail risks and the likelihood of a total collapse.
What the Jamaica model shows
The model’s key output is therefore a distribution of possible ecosystem outcomes and how that distribution changes under intervention.
In this case, the business-as-usual and intervention scenarios produce materially different environmental conditions and ecological outcomes (Figure 3 & 4). Under business-as-usual, water-column dissolved inorganic nitrogen and porewater ammonium are high (shifted to the right) and wide, exposing the meadow to a broad range of damaging nutrient conditions over time. Under intervention, both distributions shift materially lower (to the left), improving not just the average condition but the full range of nutrient stress the meadow experiences.
That distinction matters because seagrass responses are not linear. Lower nutrient stress reduces algal overgrowth, improves light availability, supports below-ground reserves, and helps preserve the meadow’s capacity to recover after a disturbance. A shift in the distribution of environmental conditions can therefore produce a much larger shift in the distribution of ecological outcomes.
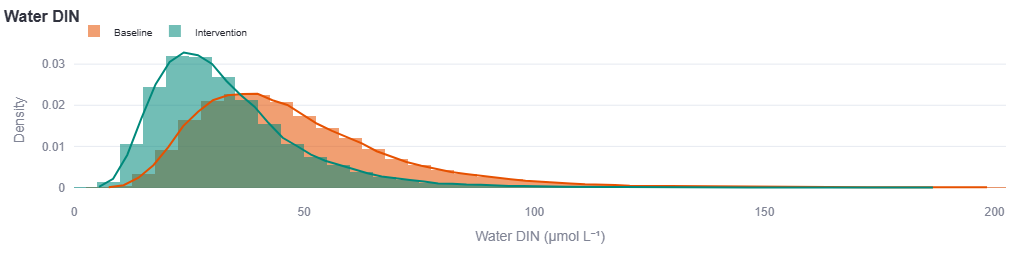
Figure 2. Marginal distribution of water-column dissolved inorganic nitrogen under the baseline and intervention scenarios. The distribution shows the range of possible nitrogen values generated under each scenario.
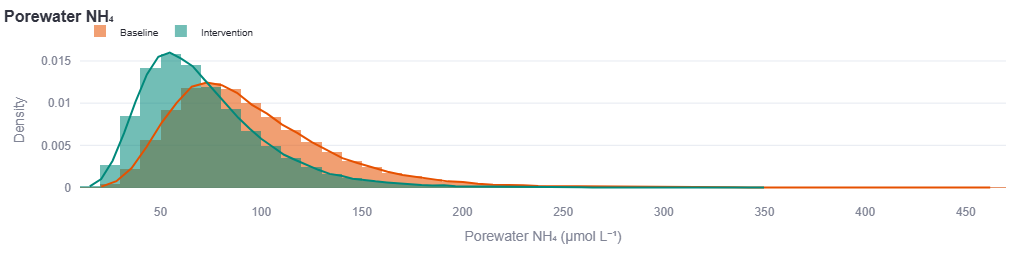
Figure 3. Marginal distribution of porewater ammonium under the baseline and intervention scenarios. The distribution shows the range of possible porewater ammonium values generated under each scenario.
That difference is clear in the biomass trajectories. Under business-as-usual, the percentile fan is wide from the start and stays wide across the full twenty-year horizon. This spread represents a vulnerable system that can with increasingly higher probability slip into a state of collapse.
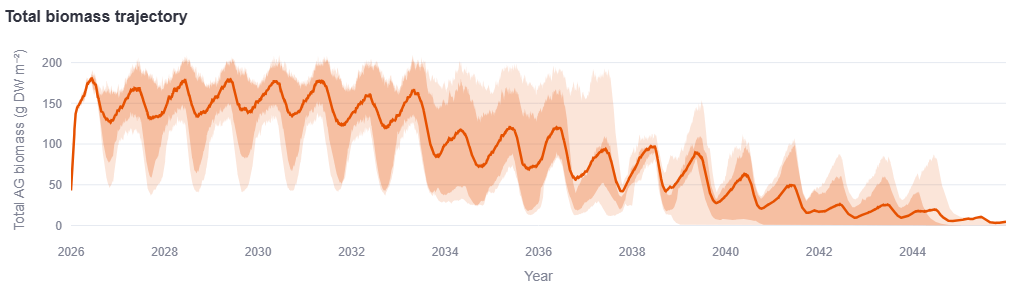
Figure 4. Twenty-year stochastic biomass trajectory under the business-as-usual scenario. The fan shows the envelope of percentile bands from the 5th to the 95th percentile across simulated scenarios.
Under intervention, the pattern is different. In the early years, the fan captures a transition phase as water quality improves over a five-year period. During that period, the system moves through recovery dynamics before settling into a healthier and more resilient steady state reflected by the tighter percentile shading.
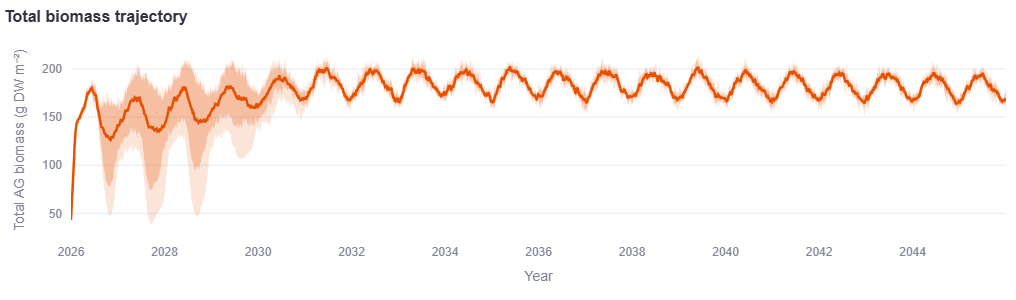
Figure 6. Twenty-year stochastic biomass trajectory under the intervention scenario. The fan shows the envelope of percentile bands from the 5th to the 95th percentile across simulated scenarios.
The quantifiable comparison between the two biomass projections is the central ecological result of this illustrative case study. Under business-as-usual, the meadow remains exposed to persistently high vulnerability. Under intervention, the system moves through a recovery phase and into a more stable and resilient state. That is exactly the kind of change in risk profile that a nature-focused modelling framework can capture, but how do we make this economically and financially relevant?
Translation of Nature to Financial Metrics
A further step is to translate the ecological distribution into an economic one. To illustrate that, we apply a simple factor-valuation for the ecosystem service provided by the seagrass. We translate modelled seagrass biomass into fish-supporting capacity [0 to 1] using a simple saturating function, so gains are strongest during recovery and taper as the meadow approaches a healthy state. This is used to scale maximum annual potential revenue per scenario, and those revenues are then discounted over a twenty-year horizon to produce a present-value distribution for a small fishing business.
This is deliberately a simplified example, however it is still useful because it shows, in a concrete way, how ecosystem outcomes can be carried through into a meaningful financial metrics. The result is a distribution of twenty-year present values under the two scenarios; business-as-usual and under intervention, rather than a single expected number.
If you are thinking about investing in a local fishery, or insuring one, the downside risk profile becomes highly decision-useful. It shows the probability that 20-year present value ends up at or below a given level. For an insurer, the key question may sit in the 1-in-100-year tail; for an investor, it may be the 1-in-5 or 1-in-10-year range, where the focus is less on catastrophe and more on whether the fishery is likely to stay viable after intervention.
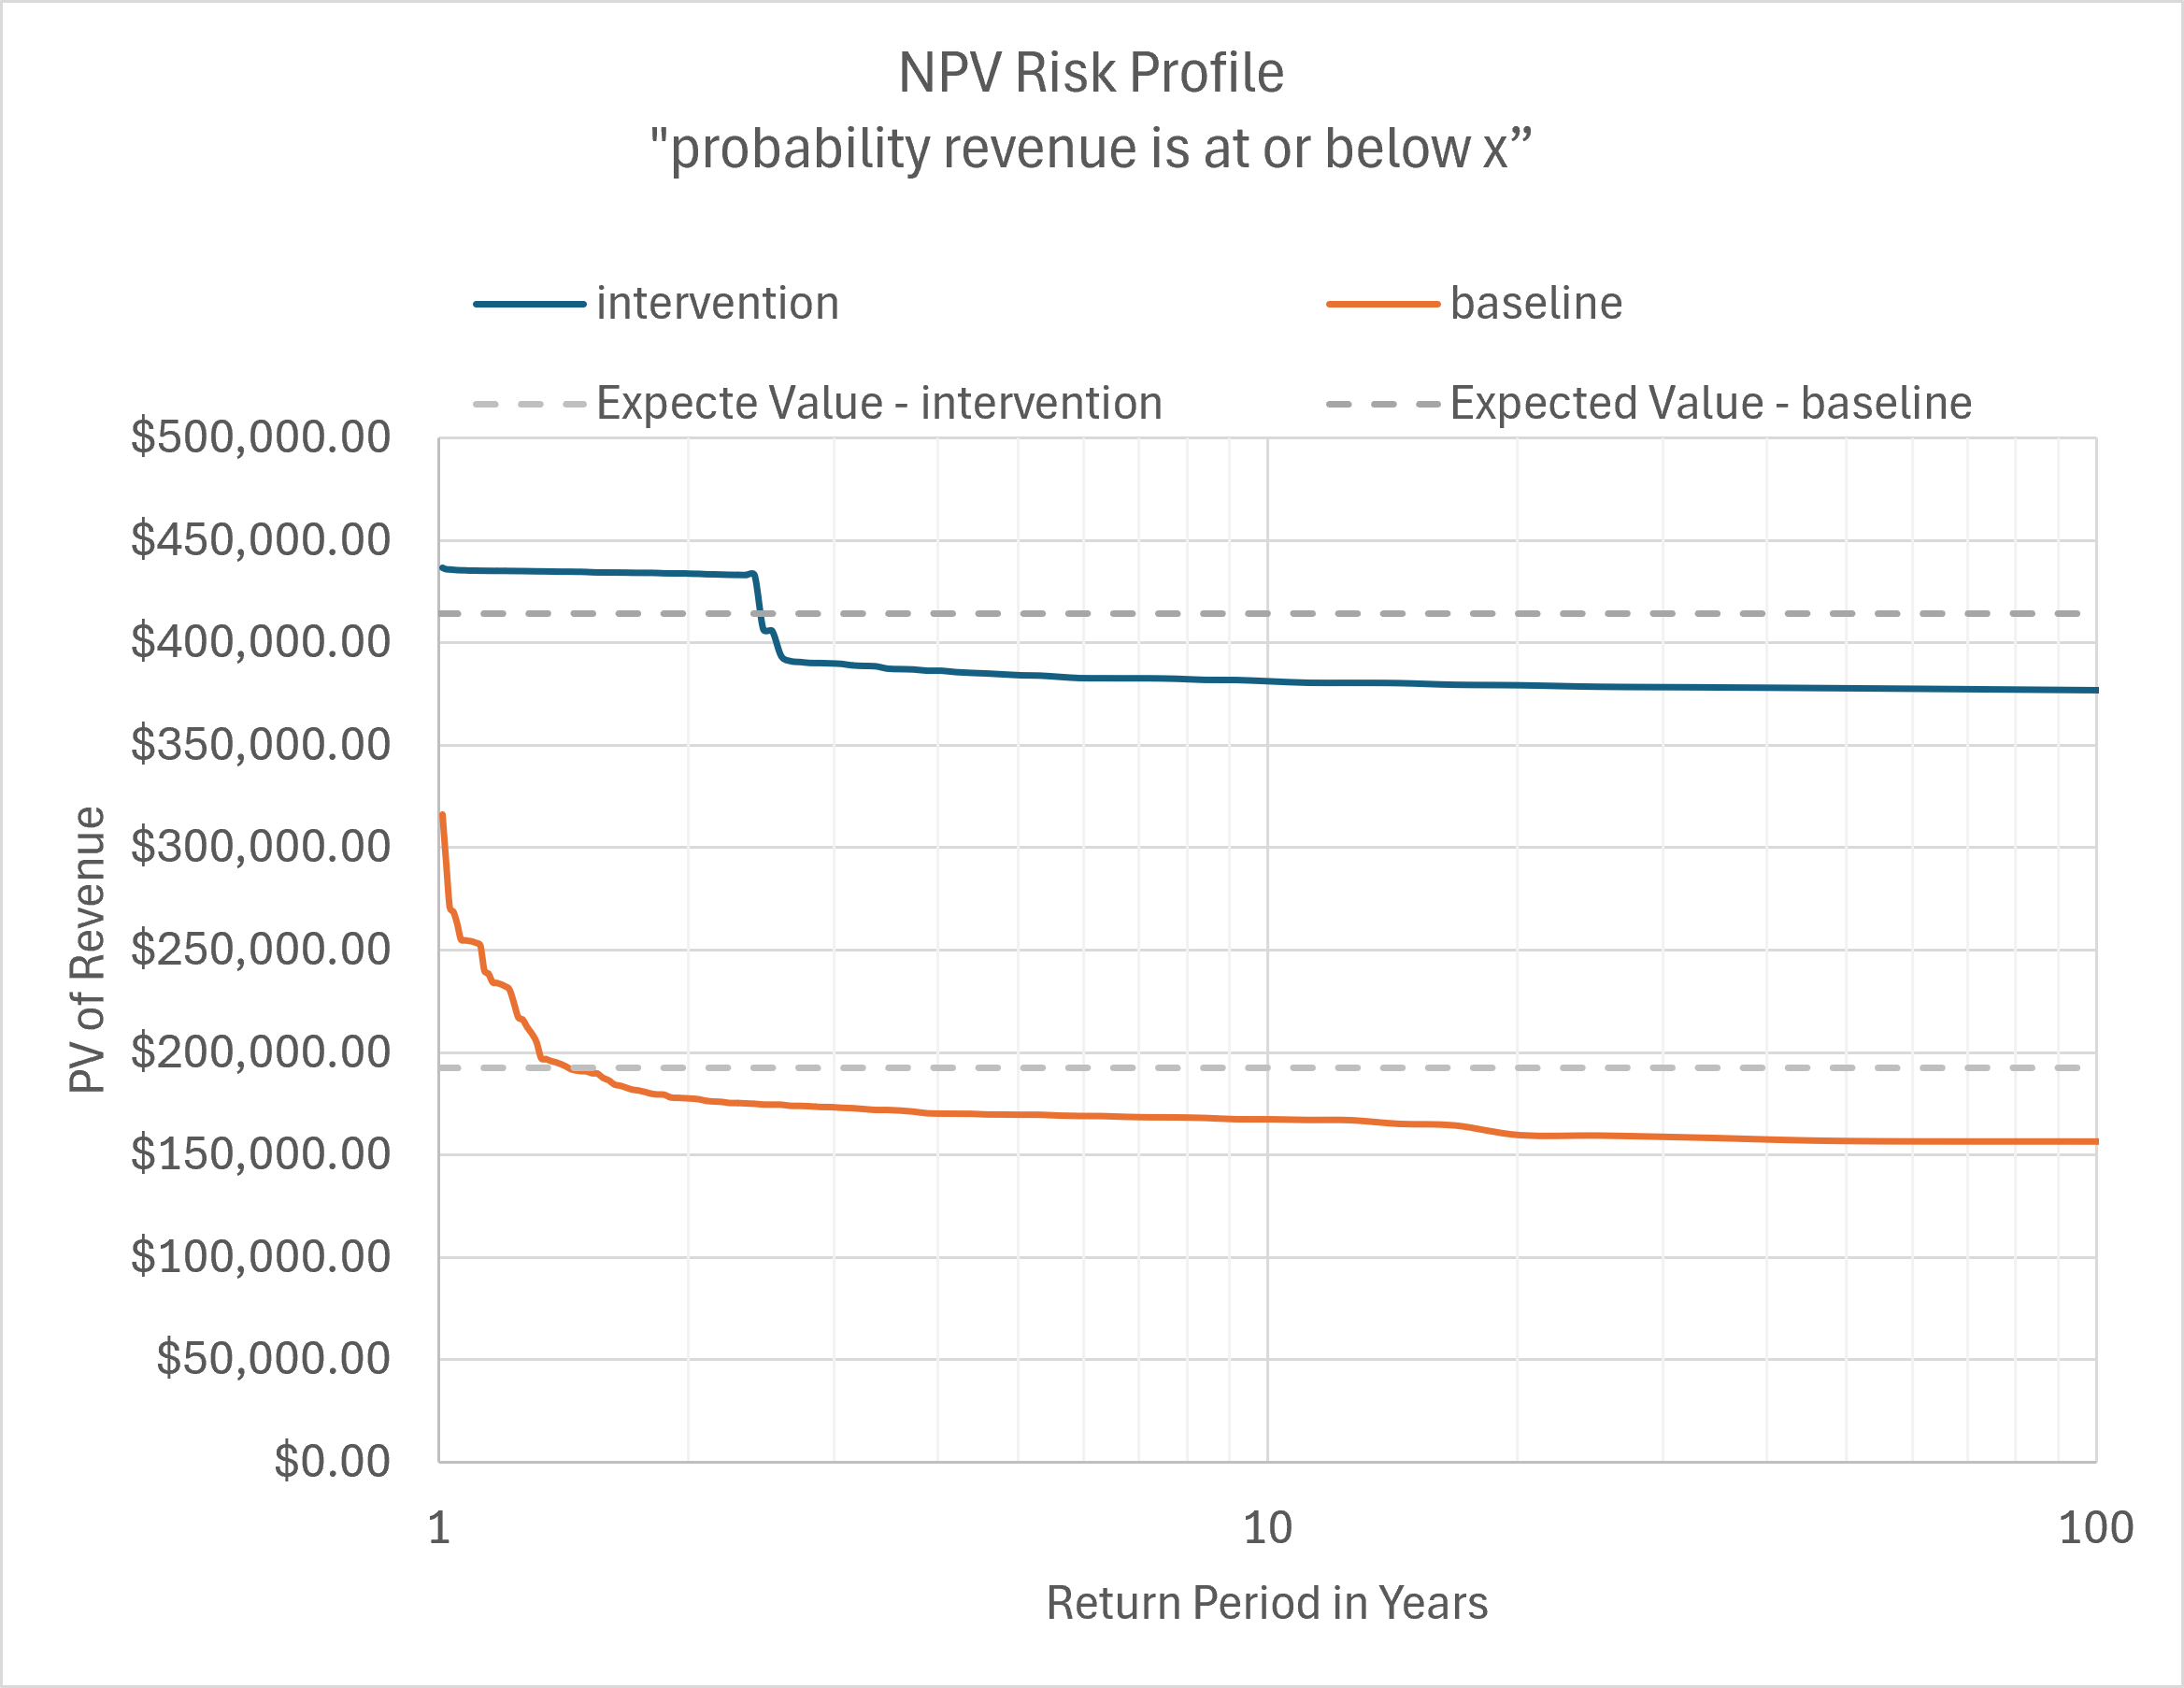
Figure 6. Downside risk profile of 20-year present value of revenue under baseline and intervention. Present values are derived from modelled seagrass biomass using a simple artisanal fish-catch revenue proxy and plotted against lower-tail return per
Each curve reads left to right as a downside risk profile: the y-axis shows a present value level, and the x-axis shows the return period in years — how rarely a given outcome or worse would be expected to occur. A point on the curve at a return period of 10 years means there is roughly a 1-in-10 chance that revenue falls at or below that value over the 20-year horizon. Rarer, more severe outcomes appear further to the right.
The gap between the two curves is the value of intervention. Under business-as-usual (orange), the downside is severe across all return periods, with an expected revenue of around $190,000. Under intervention (dark blue), the entire distribution shifts materially upward — expected value rises to around $415,000, and even the 1-in-100-year outcome remains above $370,000. Intervention does not eliminate risk, but it fundamentally changes its shape and magnitude.
One feature of the intervention curve is a temporary step in the downside range during the recovery period. In ecological terms, that is consistent with a transition state in which lower-biomass pioneer species such as Halodule dominate before a fuller recovery toward a heavier Thalassia-dominated meadow, which is exactly the kind of non-linear regime behaviour that a static nature assessment would miss.
Why this matters to business
The relevance to business is not that every company should build its own ecosystem model, or that this specific valuation proxy is the final answer. It is that quantified ecological risk can, in principle, be translated into a distribution of service-linked financial outcomes, and that supports a different class of decision.
A qualitative disclosure might say that a company is exposed to coastal ecosystem degradation and that this could affect operations, supply chains, or future revenues. That is useful as a flag. But it does not tell a CFO whether the exposure is marginal or material, whether it is concentrated or diversified, whether it is worsening, or whether an intervention would reduce downside risk sufficiently to justify capital allocation. It rarely changes a balance sheet decision on its own.
A quantified risk profile, or similar financial metrics, can show a range of possible ecosystem outcomes, identify which variables drive the downside tail, and estimate how that distribution changes under intervention. For a CFO, that is decision-useful. It can inform contingent capital decisions, resilience spending, supplier strategy, insurance discussions, covenant thinking, and whether to treat certain interventions as discretionary ESG activity or as economically rational asset protection. The difference is the same as the difference between saying “there may be a risk here” and saying “here is the shape, magnitude, and uncertainty of that risk.”
A developing field
Nature-related scenario analysis is still an emerging field. Methods are developing, assurance frameworks are immature, and not every ecosystem or business question will suit the same modelling architecture. That should be acknowledged plainly.
But the absence of a final standard does not mean the field should remain static or qualitative. Where ecosystems are economically material, there is a credible basis for moving beyond static descriptions and toward models that reflect complexity, uncertainty, and changing conditions more honestly. The Jamaica case study is an illustrative example of how that can be done. It is not the only approach, and it is not the endpoint, but it demonstrates an important principle: if nature is dynamic, uncertain, and non-linear, then the analysis used to assess nature-related risk should be too.
Dr Roger Iles - Ecometry